放大缩小
使用一(这个正常使用)
1
2
3
4
5
6
7
8
9
10
11
12
13
14
15
16
17
18
19
20
21
22
23
24
25
26
27
28
29
| this.chart1.MouseWheel += new System.Windows.Forms.MouseEventHandler(this.chart1_MouseWheel);
private void chart1_MouseWheel(object sender, MouseEventArgs e)
{
if(e.Delta == 120)
{
if (chart1.ChartAreas[0].AxisX.ScaleView.Size > 0)
{
chart1.ChartAreas[0].AxisX.ScaleView.Size /= 2;
}
else
{
chart1.ChartAreas[0].AxisX.ScaleView.Size = chart1.Series[0].Points.Count/2;
}
}
else if (e.Delta == -120)
{
if (chart1.ChartAreas[0].AxisX.ScaleView.Size > 0)
{
chart1.ChartAreas[0].AxisX.ScaleView.Size *= 2;
}
else
{
chart1.ChartAreas[0].AxisX.ScaleView.Size = chart1.Series[0].Points.Count * 2;
}
}
}
|
放大缩小二
添加鼠标滚轮事件
1
| this.chart1.MouseWheel += new System.Windows.Forms.MouseEventHandler(this.chart1_MouseWheel);
|
实现鼠标滚轮事件
1
2
3
4
5
6
7
8
9
10
11
12
| private void chart1_MouseWheel(object sender, MouseEventArgs e)
{
if (chart1.ChartAreas[0].AxisX.ScaleView.Size > 0)
{
chart1.ChartAreas[0].AxisX.ScaleView.Size += (e.Delta / 120);
}
else if(e.Delta > 0)
{
chart1.ChartAreas[0].AxisX.ScaleView.Size += (e.Delta / 120);
}
}
|
左右平移
平移使用一(这个正常使用)
1
2
3
4
5
6
7
8
9
10
11
12
13
14
15
16
17
18
19
20
21
22
23
24
25
26
27
| public int chartBeforePoint = 0;
bool chartFlag = false;
private void chart1_MouseDown(object sender, MouseEventArgs e)
{
chartBeforePoint = 0;
chartFlag = true;
}
private void chart1_MouseUp(object sender, MouseEventArgs e)
{
chartFlag = true;
}
private void chart1_MouseMove(object sender, MouseEventArgs e)
{
if (chartFlag)
{
if (chartBeforePoint != 0 && e.X - chartBeforePoint > 0)
chart1.ChartAreas[0].AxisX.ScaleView.Position += 1;
else if (chartBeforePoint != 0 && e.X - chartBeforePoint < 0)
chart1.ChartAreas[0].AxisX.ScaleView.Position -= 1;
chartBeforePoint = e.X;
}
}
|
平移使用二
初始化有关参数
1
2
3
4
5
6
7
8
9
10
11
12
|
public bool isMouseDown = false;
public int lastMove = 0;
chart1.ChartAreas[0].AxisX.ScaleView.Size = 5;
chart1.ChartAreas[0].AxisX.ScrollBar.Enabled = false;
chart1.ChartAreas[0].AxisY.ScrollBar.Enabled = false;
chart1.ChartAreas[0].CursorX.IsUserEnabled = false;
chart1.ChartAreas[0].CursorX.AutoScroll = false;
chart1.ChartAreas[0].CursorX.IsUserSelectionEnabled = false;
|
添加鼠标按下、弹起和移动事件
- 上述事件在chart控件中均自带,直接添加即可,事件代码如下:
1
2
3
4
5
6
7
8
9
10
11
12
13
14
15
16
17
18
19
20
21
22
23
24
|
private void chart1_MouseDown(object sender, MouseEventArgs e)
{
lastMove = 0;
isMouseDown = true;
}
private void chart1_MouseUp(object sender, MouseEventArgs e)
{
isMouseDown = false;
}
private void chart1_MouseMove(object sender, MouseEventArgs e)
{
if (isMouseDown)
{
if(lastMove != 0 && e.X - lastMove > 0)
chart1.ChartAreas[0].AxisX.ScaleView.Position += 1;
else if(lastMove != 0 && e.X - lastMove < 0)
chart1.ChartAreas[0].AxisX.ScaleView.Position -= 1;
lastMove = e.X;
}
}
|
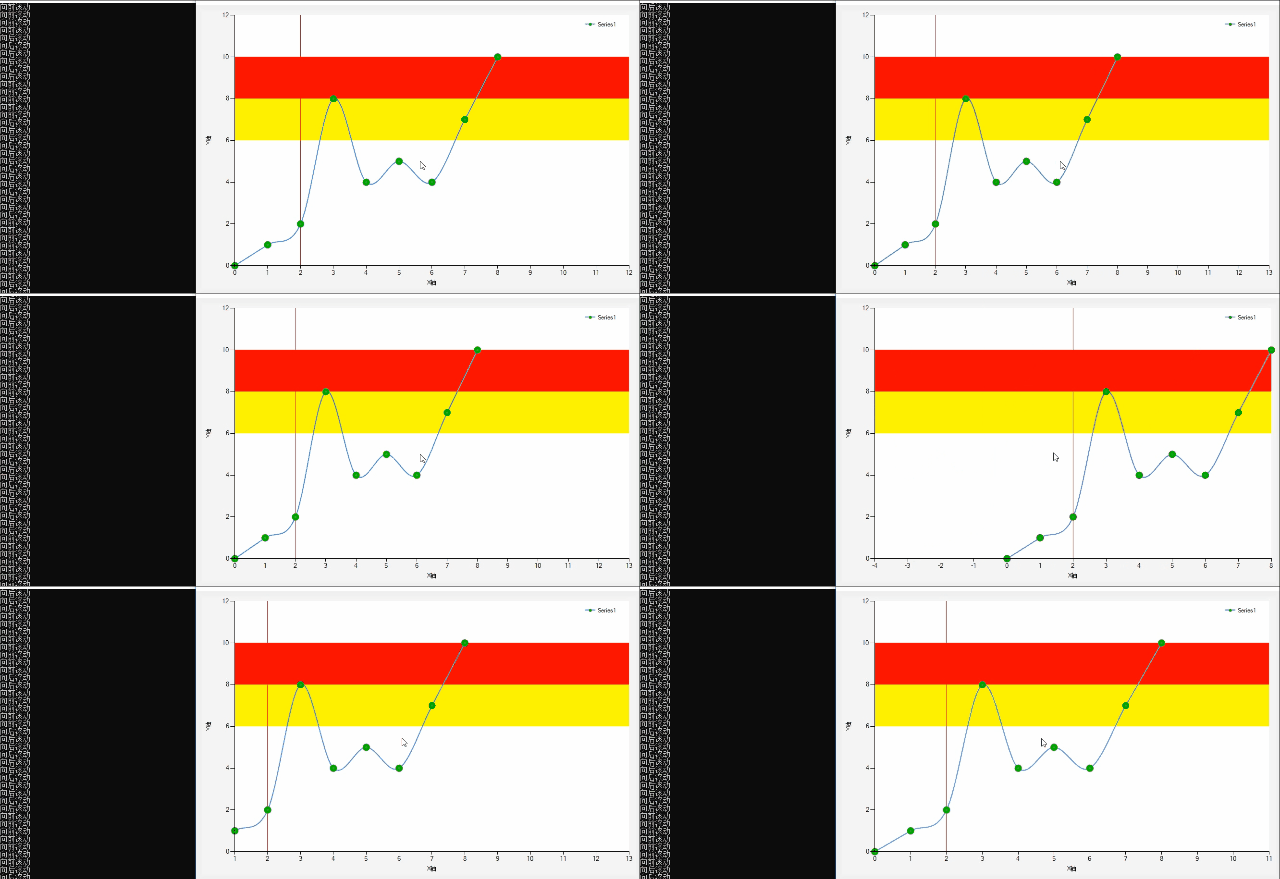
最终效果如下,图片前面黑呼呼的为控制台输出,似乎有点看不清(可忽略),可观察到鼠标滚轮的变化。
拓展chart(如何简单使用Chart图表)
Chart控件可以用来绘制波形图、柱状图、饼图、折线图等,用来进行数据表现是很不错的,现在简单说一下这个控件的使用方法
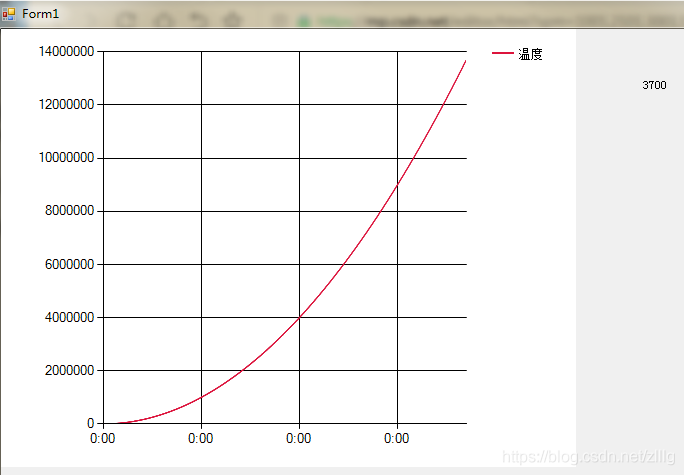
效果图
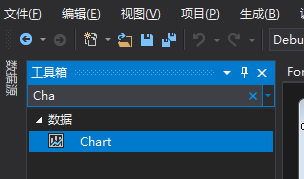
我们首先要加载Chart控件
然后打开控件的属性窗口

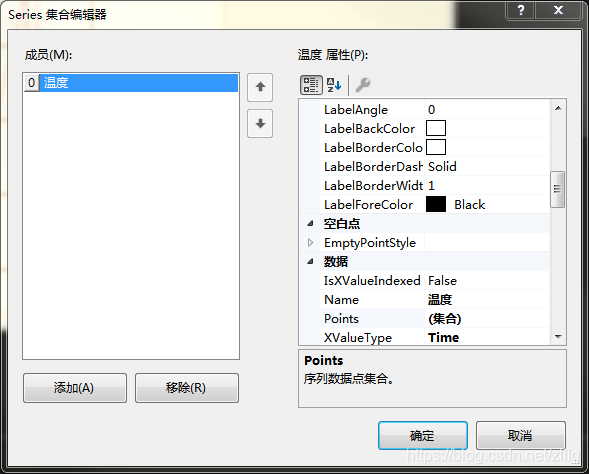
在这个窗口里面我们可以修改曲线的名称,名称在【数据》Name】里面修改
数据
XValueType是X轴的数据类型,Y同理,这里我们选Time,可以随时间改变
图表
ChartType是图表的类型,我们可以选出我们想要用的类型,这里选曲线
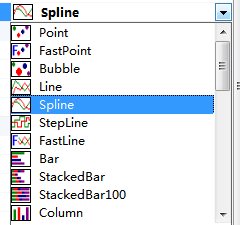
外观
Color可以选择曲线的颜色,这里我选了红色
左边的成员 框,是我们要显示的曲线,可以添加多个
其他属性如果有需要自行修改,修改好之后确定,回到窗口设计界面
添加数据
在工具箱添加Timer
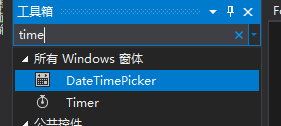
在Timer的事件窗口双击时钟事件

代码:
1
2
3
4
5
6
7
8
9
10
11
12
13
14
15
16
17
18
19
20
21
22
23
24
25
| public partial class Form1 : Form
{
int cnt = 0;
public Form1()
{
InitializeComponent();
}
private void Form1_Load(object sender, EventArgs e)
{
timer1.Enabled = true;
}
private void timer1_Tick(object sender, EventArgs e)
{
chart1.Series[0].Points.AddY(cnt*cnt);
label1.Text = cnt.ToString();
cnt++;
}
private void chart1_Click(object sender, EventArgs e)
{
}
}
|
cnt是个自变量,曲线显示的是cnt为底的2次指数曲线
相关链接(侵删)
- C#Chart使用鼠标滚轮放大,缩小,平移曲线
- C# Chart折线图使用鼠标滚轮放大、缩小和平移曲线方式
=================我是分割线=================
欢迎到公众号来唠嗑:


