额外参考链接:http://www.cnblogs.com/greenerycn/archive/2008/10/27/microsoft-chart.html
首先添加引用System.Windows.Forms.DataVisualization,添加引用后,工具面板上将在数据中显示Chart,可直接拖拽到界面上。
代码中添加 Using System.Windows.Forms.DataVisualization.Charting;

1. 当拖拽Chart到界面上时,一般来说Chart及其ChartAreas、Legend部分的背景为白色,我们可以分别通过各自的BackColor设置为透明或其他颜色。
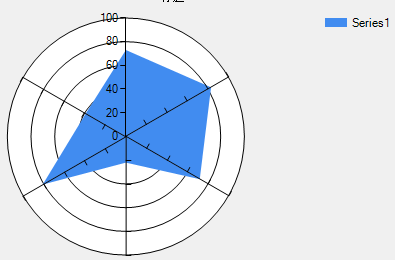
通过设置Series的ChartType属性来选择图表类型,一般常用:折线Line,柱状图Column,饼状图Pie,雷达图Redar等等。
2. 设置ChartAreas属性
1
2
3
4
5
6
7
8
9
10
11
12
13
14
| ct.ChartAreas.Add(new ChartArea() { Name = "ca1" });
ct.ChartAreas[0].Axes[0].MajorGrid.Enabled = false;
ct.ChartAreas[0].Axes[1].MajorGrid.Enabled = false;
ct.ChartAreas[0].Axes[0].MajorGrid.LineDashStyle = ChartDashStyle.Dash;
ct.ChartAreas[0].Axes[0].MajorGrid.LineColor = Color.Gray;
ct.ChartAreas[0].Axes[0].MajorTickMark.Enabled = false;
ct.ChartAreas[0].Axes[1].MajorTickMark.Enabled = false;
ct.ChartAreas[0].Axes[1].IsInterlaced = true;
ct.ChartAreas[0].Axes[0].LabelStyle.Format = "#年";
ct.ChartAreas[0].Axes[1].MajorGrid.LineDashStyle = ChartDashStyle.Dash;
ct.ChartAreas[0].Axes[1].MajorGrid.LineColor = Color.Blue;
ct.ChartAreas[0].Axes[1].MajorGrid.LineWidth = 3;
ct.ChartAreas[0].BackColor = System.Drawing.Color.Transparent;
|
3. 设置值Series
1
2
3
4
5
6
7
8
9
10
11
12
13
14
15
16
17
18
19
20
21
22
23
24
25
26
27
28
29
30
31
32
33
34
35
36
|
List<int> txData2 = new List<int>() { 2011, 2012, 2013, 2014, 2015, 2016 };
List<int> tyData2 = new List<int>() { 9, 6, 7, 4, 5, 4 };
List<int> txData3 = new List<int>() { 2012 };
List<int> tyData3 = new List<int>() { 7 };
ct.Series.Add(new Series());
ct.Series[0].Label = "#VAL";
ct.Series[0].ToolTip = "#VALX年\r#VAL";
ct.Series[0].ChartArea = ct.ChartAreas[0].Name;
ct.Series[0].ChartType = SeriesChartType.Line;
ct.Series[0].Points.DataBindXY(txData2, tyData2);
ct.Series[0].Color = Color.Red;
ct.Series[0].BorderWidth = 3;
ct.Series[0].MarkerBorderColor = Color.Red;
ct.Series[0].MarkerBorderWidth = 3;
ct.Series[0].MarkerColor = Color.Red;
ct.Series[0].MarkerSize = 5;
ct.Series[0].MarkerStyle = MarkerStyle.Circle;
ct.Series.Add(new Series());
ct.Series[1].Label = "#VAL";
ct.Series[1].ToolTip = "#VALX年\r#VAL";
ct.Series[1].ChartArea = "ca1";
ct.Series[1].ChartType = SeriesChartType.Line;
ct.Series[1].Points.DataBindXY(txData3, tyData3);
ct.Series[1].Color = Color.Black;
ct.Series[1].BorderWidth = 3;
ct.Series[1].MarkerBorderColor = Color.Black;
ct.Series[1].MarkerBorderWidth = 3;
ct.Series[1].MarkerColor = Color.Black;
ct.Series[1].MarkerSize = 5;
ct.Series[1].MarkerStyle = MarkerStyle.Circle;
|
4. 其他ChartType的特殊设置
1
2
3
4
5
6
|
ct.Series[0]["PieLabelStyle"] = "Outside";
ct.Series[0]["PieLineColor"] = "Black";
ct.Series[0]["DrawingStyle"] = "Emboss";
ct.Series[0]["PointWidth"] = "0.5";
|
5. 几种ChartType展示
 |
 |
 |
 |
| 折线图-Line |
柱状图-Column |
饼状图-Pie |
雷达图-Redar |
 |
 |
 |
|
| Spline |
Bar |
Doughnut |
|
C#的CHART 怎么设置不显示格网
方法一:代码设置
使用如下代码:
1
2
3
| this.chart1.chartArea[0].AxisX.MajorGrid.LineColor = System.Drawing.Color.Transparent;
this.chart1.chartArea[0].AxisY.MajorGrid.LineColor = System.Drawing.Color.Transparent;
|
方法二:在属性栏上设置


相关链接(侵删)
- c# Winform Chart入门
- C#的CHART 怎么设置不显示格网
=================我是分割线=================
欢迎到公众号来唠嗑:


